Even if “| delete” is not a very common command, it’s used from time to time to clean up unwanted events. So what happens if you delete data by mistake? How to recover those events when the docs say it’s not possible?
When we look at the documentation it’s stated that “Removing data is irreversible. If you want to get your data back after the data is deleted, you must re-index the applicable data sources." and “Using the delete command marks all of the events returned by the search as deleted." Re-index of data is quite often impossible when data is coming from transient data sources like MQTT or REST interfaces.
Well, what if we find these markers and remove them? Normally this should bring us in the situation where data is searchable again, right?!
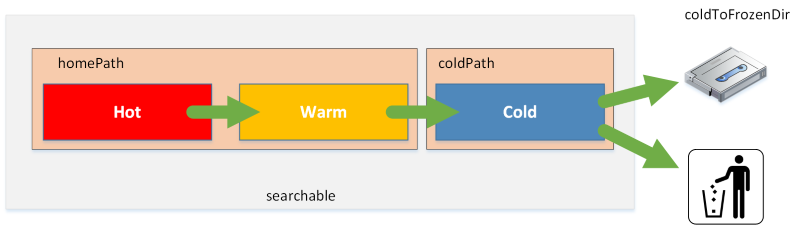
All event data in Splunk is stored in indexes. Every index consists of buckets, which are folders with a predefined naming convention. Let’s have a look at those buckets and compare a bucket with deleted and non-deleted data.
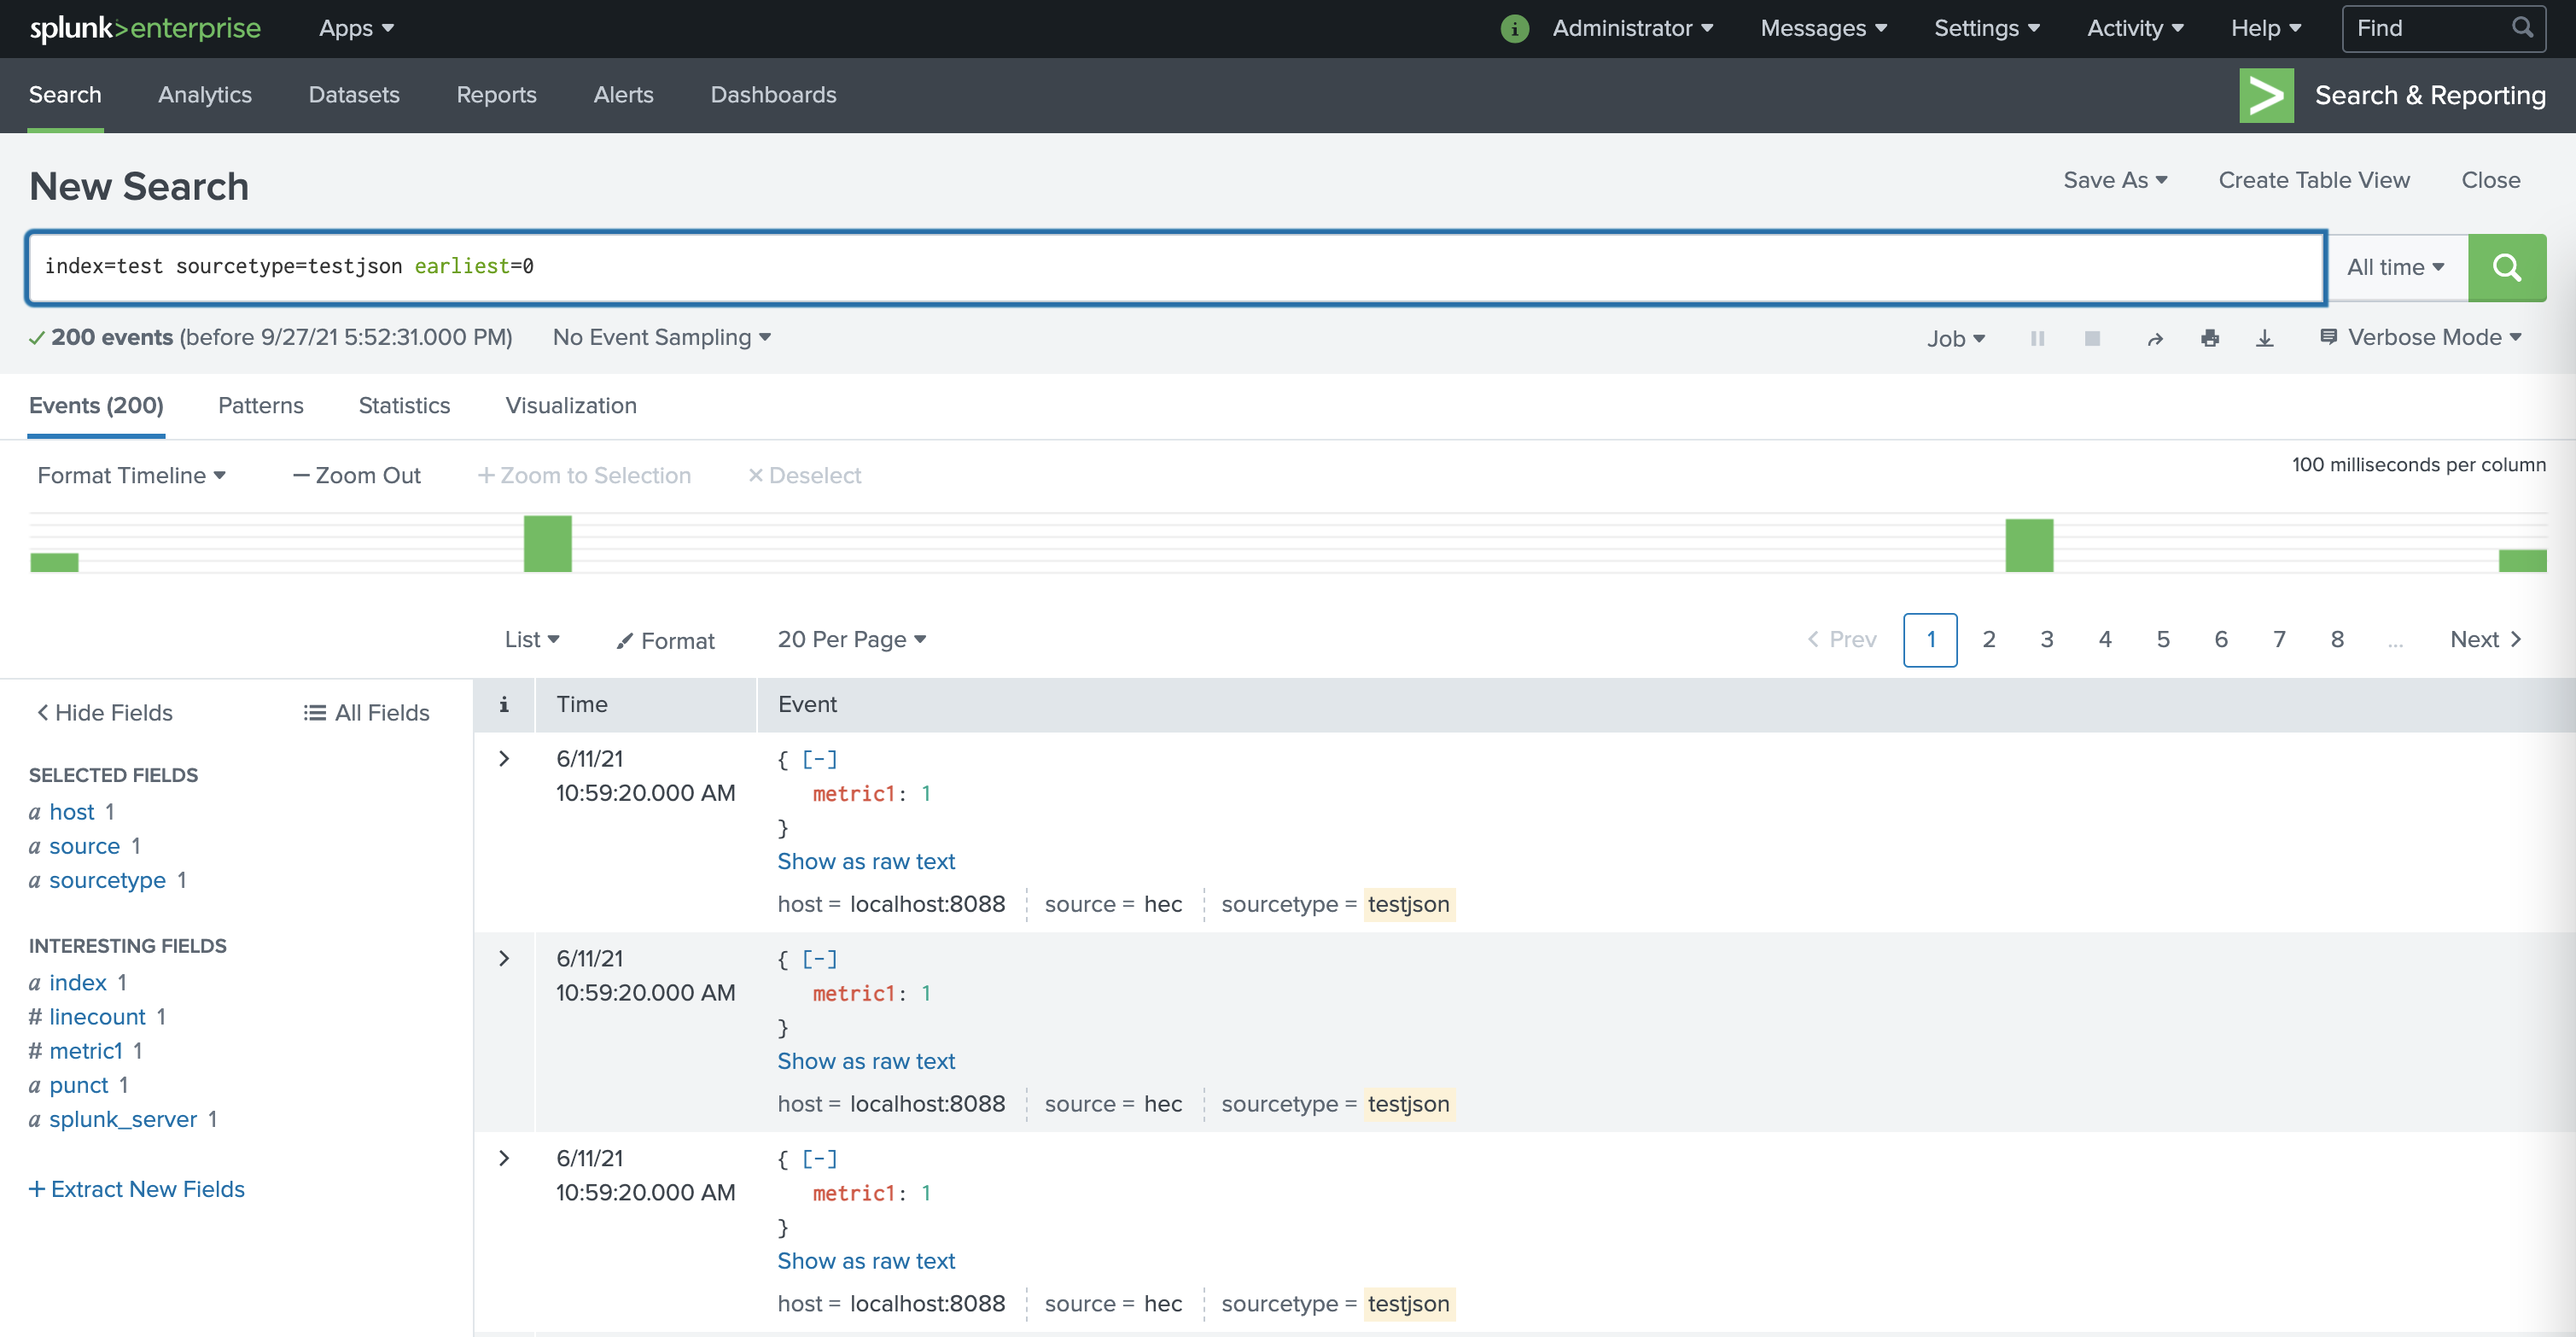
Let’s search for some data. Please note that the internal field _bkt is the bucket where an event is stored.
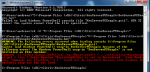
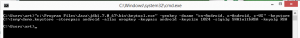
splunk search "index=test sourcetype=testjson earliest=0 | stats count values(_bkt) as bucket values(index) as index | table index count bucket"
index count                   bucket
----- ----- -------------------------------------------
test    200 test~5~8318D59B-46EF-45B4-ACFA-AB89AAF73434```
Here we find 200 events of sourcetype testjson in the index “test” in the bucket test~5~8318D59B-46EF-45B4-ACFA-AB89AAF73434. Let’s jump into the filesystem structure and find this bucket/folder.
db_1623401960_1623401955_5
├── 1623401960-1623401955-14536582616925630097.tsidx
├── Hosts.data
├── SourceTypes.data
├── Sources.data
├── bloomfilter
├── bucket_info.csv
├── optimize.result
└── rawdata
    ├── 0
    └── slicesv2.dat
total 56
-rw-------  1 andreas  staff  4640 11 Jun 11:03 1623401960-1623401955-14536582616925630097.tsidx
-rw-------  1 andreas  staff   103 11 Jun 11:03 Hosts.data
-rw-------  1 andreas  staff   103 11 Jun 11:03 SourceTypes.data
-rw-------  1 andreas  staff    94 11 Jun 11:03 Sources.data
-rw-------  1 andreas  staff    49 11 Jun 11:03 bloomfilter
-rw-------  1 andreas  staff    67 11 Jun 10:59 bucket_info.csv
-rw-------  1 andreas  staff     0 11 Jun 11:03 optimize.result
drwx------  4 andreas  staff   128 11 Jun 11:03 rawdata
This is how a bucket looks like: The rawdata subdirectory contains the original events in a compressed format. The *.tsidx files are the index over those rawdata events. *.data files are holding meta information about the rawdata source, sourcetype and hosts fields.
We run all commands from the cli, as this might be easier to read in the article. Now let’s delete some data using the “| delete” command.
splunk search "index=test sourcetype=testjson earliest=0 | delete"
INFO: 200 events successfully deleted
      splunk_server         index  deleted errors
-------------------------- ------- ------- ------
andreass-MacBook-Pro.local __ALL__     200      0
and search for the data again:
splunk search "index=test sourcetype=testjson earliest=0 | stats count"
count
-----
    0
It seems as if the data is now deleted, or rather “marked as delete” successfully.
Now let’s run tree and ls again:
db_1623401960_1623401955_5
├── 1623401960-1623401955-14536582616925630097.tsidx
├── Hosts.data
├── SourceTypes.data
├── Sources.data
├── bloomfilter
├── bucket_info.csv
├── optimize.result
└── rawdata
    ├── 0
    ├── deletes
    │   └── 8c1659e22188a580759cbf34a6e26308.csv.gz
    └── slicesv2.dat
total 56
-rw-------  1 andreas  staff  4640 27 Sep 18:07 1623401960-1623401955-14536582616925630097.tsidx
-rw-------  1 andreas  staff   103 11 Jun 11:03 Hosts.data
-rw-------  1 andreas  staff   103 11 Jun 11:03 SourceTypes.data
-rw-------  1 andreas  staff    94 11 Jun 11:03 Sources.data
-rw-------  1 andreas  staff    49 11 Jun 11:03 bloomfilter
-rw-------  1 andreas  staff    67 11 Jun 10:59 bucket_info.csv
-rw-------  1 andreas  staff     0 11 Jun 11:03 optimize.result
drwx------  5 andreas  staff   160 27 Sep 18:07 rawdata
Well, let’s have a closer look at the buckets 1623401960-1623401955-14536582616925630097.tsidx file. From the timestamp we see that this file has been modified while we deleted the data. Let’s try to rebuild this .tsidx file. So we stop Splunk and run rebuild using the “splunk fsck repair” command.
splunk stop
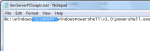
rm -f /Users/andreas/splunk/var/lib/splunk/test/db/db_1623401960_1623401955_5/1623401960-1623401955-14536582616925630097.tsidx
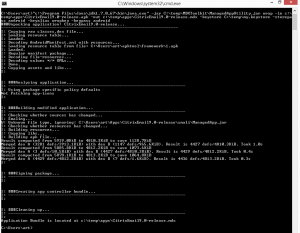
splunk fsck repair --one-bucket --bucket-path=/Users/andreas/splunk/var/lib/splunk/test/db/db_1623401960_1623401955_5
splunk start
and search again:
splunk search "index=test sourcetype=testjson earliest=0 | stats count"
count
-----
    0
No luck.. data still not searchable. Looks like we have overseen something.
Let’s have a closer look at the bucket.. see the “deletes” subdirectory from rawdata? This directory and it’s content was also created when we deleted the data. Now, let’s stop Splunk, remove the “deletes” subdirectory and repair the bucket again.
splunk stop
rm -rf ~/splunk/var/lib/splunk/test/db/db_1623401960_1623401955_5/rawdata/deletes

splunk fsck repair --one-bucket --bucket-path=/Users/andreas/splunk/var/lib/splunk/test/db/db_1623401960_1623401955_5

splunk start
Voila, the data is available again.
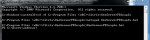
splunk search "index=test sourcetype=testjson earliest=0 | stats count"

count
-----
  200
When running the “| delete” command, Splunk is actively changing the .tsidx index files to ensure searching of the deleted data is not possible anymore.
Besides that, the subdirectory “deletes” with markers to the deleted events in rawdata is created. Those markers come into play when the bucket is recreated from rawdata. Those recreation will take place if you thaw a frozen bucket from an archive or make replicated buckets searchable using index clustering. For that reason the first recovery attempt failed, as the “deletes” directory just marked the events in the index “deleted” again.
This mechanism makes Splunk Enterprise consuming more storage when you are deleting data.
If you would just restore the .tsidx file from your backup the events are immediately searchable again - even without a splunk restart. BUT if you are not cleaning up the “deletes” directory, events will be marked as deleted at the next index rebuild. So be aware when recovering buckets from backup: always recovery the entire bucket and ensure the “deletes” subdirectory is also deleted!
Happy backup & restore!
]]>
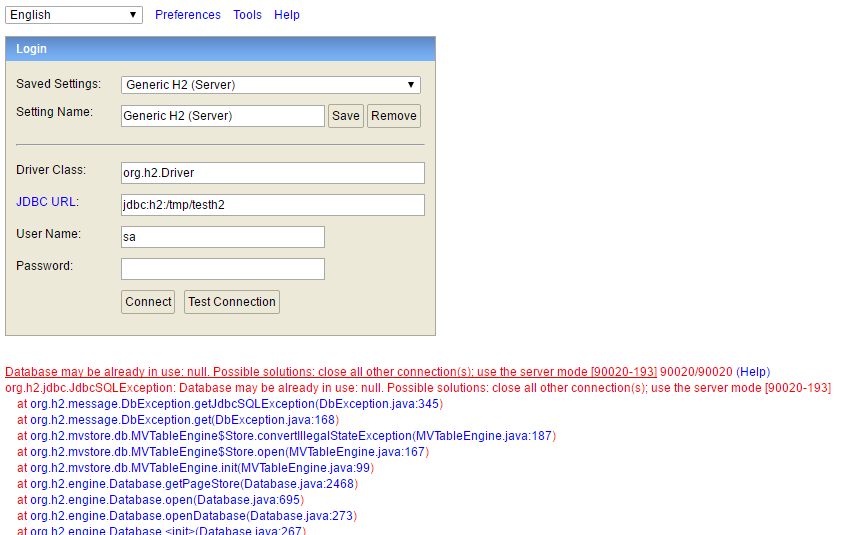


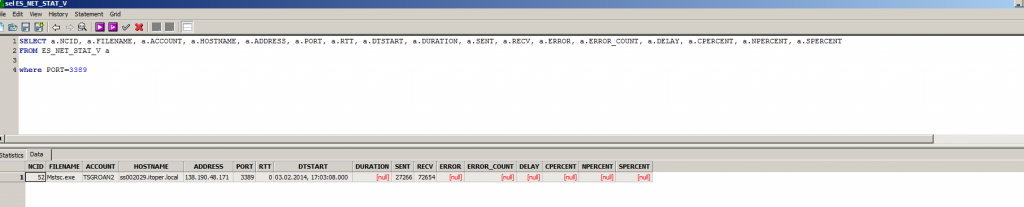

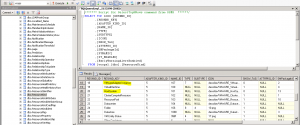
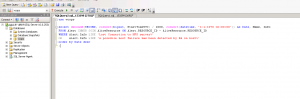
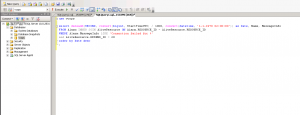
 With that SQL query you can workaround that problem.