Nagios Plugin to check Splunk license usage
In today’s article about Splunk monitoring we want to monitor the Splunk license usage. You want to keep an eye on the license usage, as 5 warnings of the daily indexing volume using the enterprise license or 3 warnings using the free license will cause a license violation.
A license violation will deactivate Splunk searches but not the indexing process. So you will not be able to query your data – but at least never loose it.
Typically a license warning is displayed in the web console of Splunk.
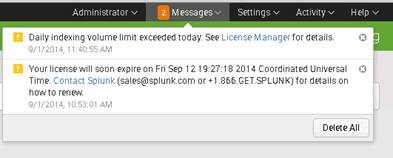
This warning is fine – but you want to get a notification using your normal monitoring and escalation process it’s simply not enough. For that reason I created a Powershell script which queries Splunk for the amount of indexed data and creates warningor critical events in your monitoring solution (e.g. Nagios)
As in the other monitoring articles for checking client versions and connections to Forwarder Management I’m using Splunk Powershell resource kit. Again – you will just need a Windows machine for executing the Powershell script – your Indexers could be running on non-Windows machines.
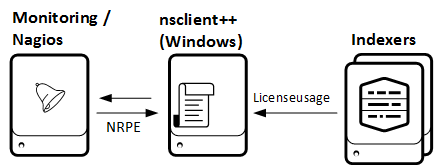
Setup monitoring using nsclient++ on Windows
Find the Download for the Script here.
Download and extract the files to
C:\Program Files\NSClient++\scripts\splunk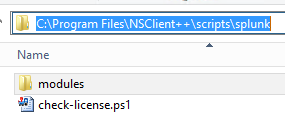
Adjust your “C:\Program Files\NSClient++\nsclient.ini” and add the external script
[/settings/external scripts/scripts]
check_splunklicense = cmd /c echo scripts\\splunk\\check-license.ps1 -servername $ARG1$ -port $ARG2$ -username $ARG3$ -password $ARG4$ -warn $ARG5$ -critical $ARG6$; exit($lastexitcode) | powershell.exe -command –
- On the Nagios server: create a new command using NRPE
define command{
command_name nt_nrpe_splunklicense
command_line /usr/lib/nagios/plugins/check_nrpe -t 30 -H $ARG1$ -p 5666 -c check_splunklicense -a $ARG2$ $ARG3$ $ARG4$ $ARG5$ $ARG6$ $ARG7$
}
- On the Nagios server: add a service to your host definition
define service{
use generic-service
host_name splunkindexer.bwlab.loc
service_description splunk license check splunk-2
check_command nt_nrpe_splunklicense!1.1.1.1!1.1.1.2!8089!admin!yourpassword!380!500
}
As you see at the command and service definition the first argument is the host where the Powershell script will be executed (1.1.1.1). The second and following arguments gives the Splunk indexer hostname (1.1.1.2) and credentials for login. The 380 and 500 pieces are the thresholds in MB for warning and critical triggers in Nagios.
Parameters
Here is a detailed list of the script parameters:
-servername

the servername or ip address to be checked – default localhost

-port

port of splunkd – default 8089

-protocol

protocol to use to communicate with splunkd – default: https

-timeout

connectiontimeout to splunkd in milliseconds – default 5000

-username

username to use to login to splunkd

-password

password to use with splunkd

-pool

licensepool to check – default “auto_generated_pool_download-trial” ..
freeversion is “auto_generated_pool_free”

 -warn

warningvalue in Megabytes

-critical

critical value in Megabytes

-showpool

display all pools found on the indexer and usage. Values could be 0 (default: don’t display) or 1 (display)
If you are unsure which license pool to use check the -showpool parameter. It will display all license pools on the indexer and the used bytes.

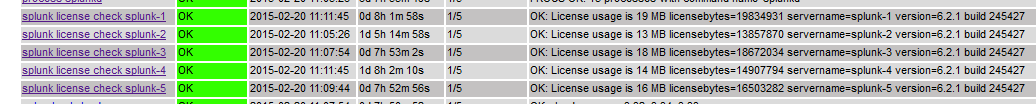
if everything is setup correctly you will be honored with great check for your licensing and will never miss a warning again.