CPU wait time in percent with a vCOps super metric
In the vSphere client performance tab of a virtual machine you can monitor the CPU Wait time, but it’s counted for every vCPU and no percentage metric is provided. vCenter Operations can solve that problem for you. With a super metric you can calculate how many percent of the time all vCPUs wait for something. vCenter 5.0 also provides the Idle and the IO-Wait time to show you what is the cause for the CPU wait time, but with vSphere 4.1 these metrics are only available in ESXTOP. DOC-9279 has a lot of background information about the ESXTOP and vSphere client performance tab metrics.
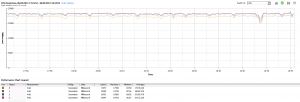
The vSphere client performance tab shows the CPU wait time in ms for all vCPUs of a virtual machine. vSphere 5 also shows you the sum of all vCPU wait times, but you are on your own to calculate how many percent of the time the vCPUs have been waiting.
With this formula vCOps takes the CPU Wait time metric divides it by the number of vCPUs, divides that by 20.000ms and by 100 to give you the percentage value.
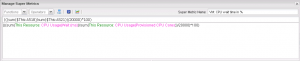
(((sum($This:A518)/sum($This:A521))/20000)*100)
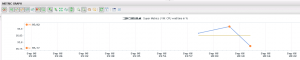
After a few minutes the metric graph displays the first percent values. Like every other metric you can use also this one in Heatmaps or other widgets, you can define KPI’s, hard thresholds and alerts for it.
In my post Using Super Metrics… you can find some background on how to configure and use super metrics.