monitor co-stop with vCenter Operations
With ESXTOP or the vCenter performance tab of a VM you can monitor the co-stop metric to check for vSMP performance problems. vCOps can show you that information for all the VMs on a host, a resource pool, a cluster, a vCenter or your complete environment. A single heatmap leads you to the part of your virtual infrastructure that has performance problems, because of there are too many virtual machines with too many vCPUs are deployed. Andy Fox has a good explanation of the co-stop metric and in the VMware communities you can find the excellent document Interpreting esxtop Statistics. The Determining if multiple virtual CPUs are causing performance issues Knowledge Base article indicates that values above 100 are a problem and that you should lower the number of vCPUs for this VM to reduce the co-stop delays.

Just create a new super metric with the formula “co-stop/provisioned CPU cores/20000*100″ and add it to a super metric package as described in my Using Super Metrics to monitor CPU %READY Part 2 article.
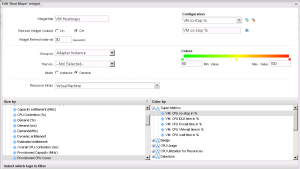
Create a new dashboard, add the heatmap and metric graph widget to it and configure both. Details on these steps you can find here.
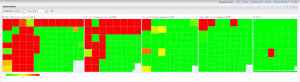
The heatmap shows you all the virtual machines with co-stop problems at a glance.